Our journey starts with the “Great Streets Pedestrian Survey,” which was conducted by the City of Los Angeles in 2015 to identify residents’ concerns and accessibility. The survey data was last updated on November 30, 2020, and can be downloaded from data.gov or data.lacity.org. The survey collected information on the reasons people visit different neighborhoods, the modes of transportation used to get there, and their activities.
Los Angeles is a city that has always been popular among photographers due to its vibrant and diverse neighborhoods. For those who enjoy street photography, Los Angeles is a city full of opportunities to capture the culture and spirit of different communities. In this blog post, we explore how data analysis and street photography can be combined to discover the great streets of Los Angeles.
Tools and equipment used
| Data Analysis 📈 | Data Analysis 📈 | Camera 📷 |
|---|---|---|
|
|
|
Konica FC-1 Hexanon AR 40mm f/1.8 |
 |
|
Olympus XA Zuiko 38mm f/2.8 |
 |
Pentax Spotmatic SMC A 20mm f/2.8 SMC A 150mm f/2.8 SMC A 50mm f/1.8 |
|
 |
Fuji X-T20 FUJINON XC 15-45mm f/3.5-5.6 OIS PZ |
Download great streets pedestrian survey at data from data.gov or data.lacity.org
Data wrangling and cleaning was important to provide geo coordinates. https://github.com/ykimdeveloper/DATA-WRANGLING-Great-Streets-Survey-ykimdeveloper
/home/u607601005/domains/republicofla.com/public_html/wp-content/uploads/2022/02/Great_Streets_Pedestrian_Survey_2015.csv is an Invalid Spreadsheet file.
Our journey starts with the “Great Streets Pedestrian Survey,” which was conducted by the City of Los Angeles in 2015 to identify residents’ concerns and accessibility. The survey data was last updated on November 30, 2020, and can be downloaded from data.gov or data.lacity.org. The survey collected information on the reasons people visit different neighborhoods, the modes of transportation used to get there, and their activities.
💡Tip! Click or zoom in the number markers! Top map is built with Folium
Data wrangling and cleaning were essential to provide geo-coordinates using APIs provided by Google Maps. We had to clean and convert the latitude and longitude from the street to ordinal values, such as 41 to 41st. The geolocations were then used to create maps and visualizations using tools such as Plotly and ArcGis.
https://github.com/ykimdeveloper/MAPS-Great-Streets-Survey-ykimdeveloper
Bottom map is built with ArcGis
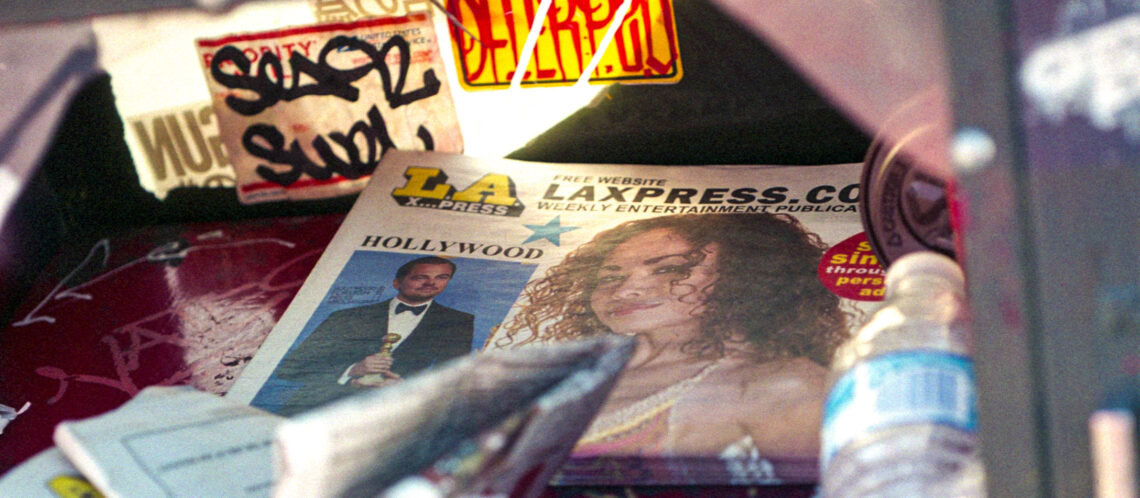
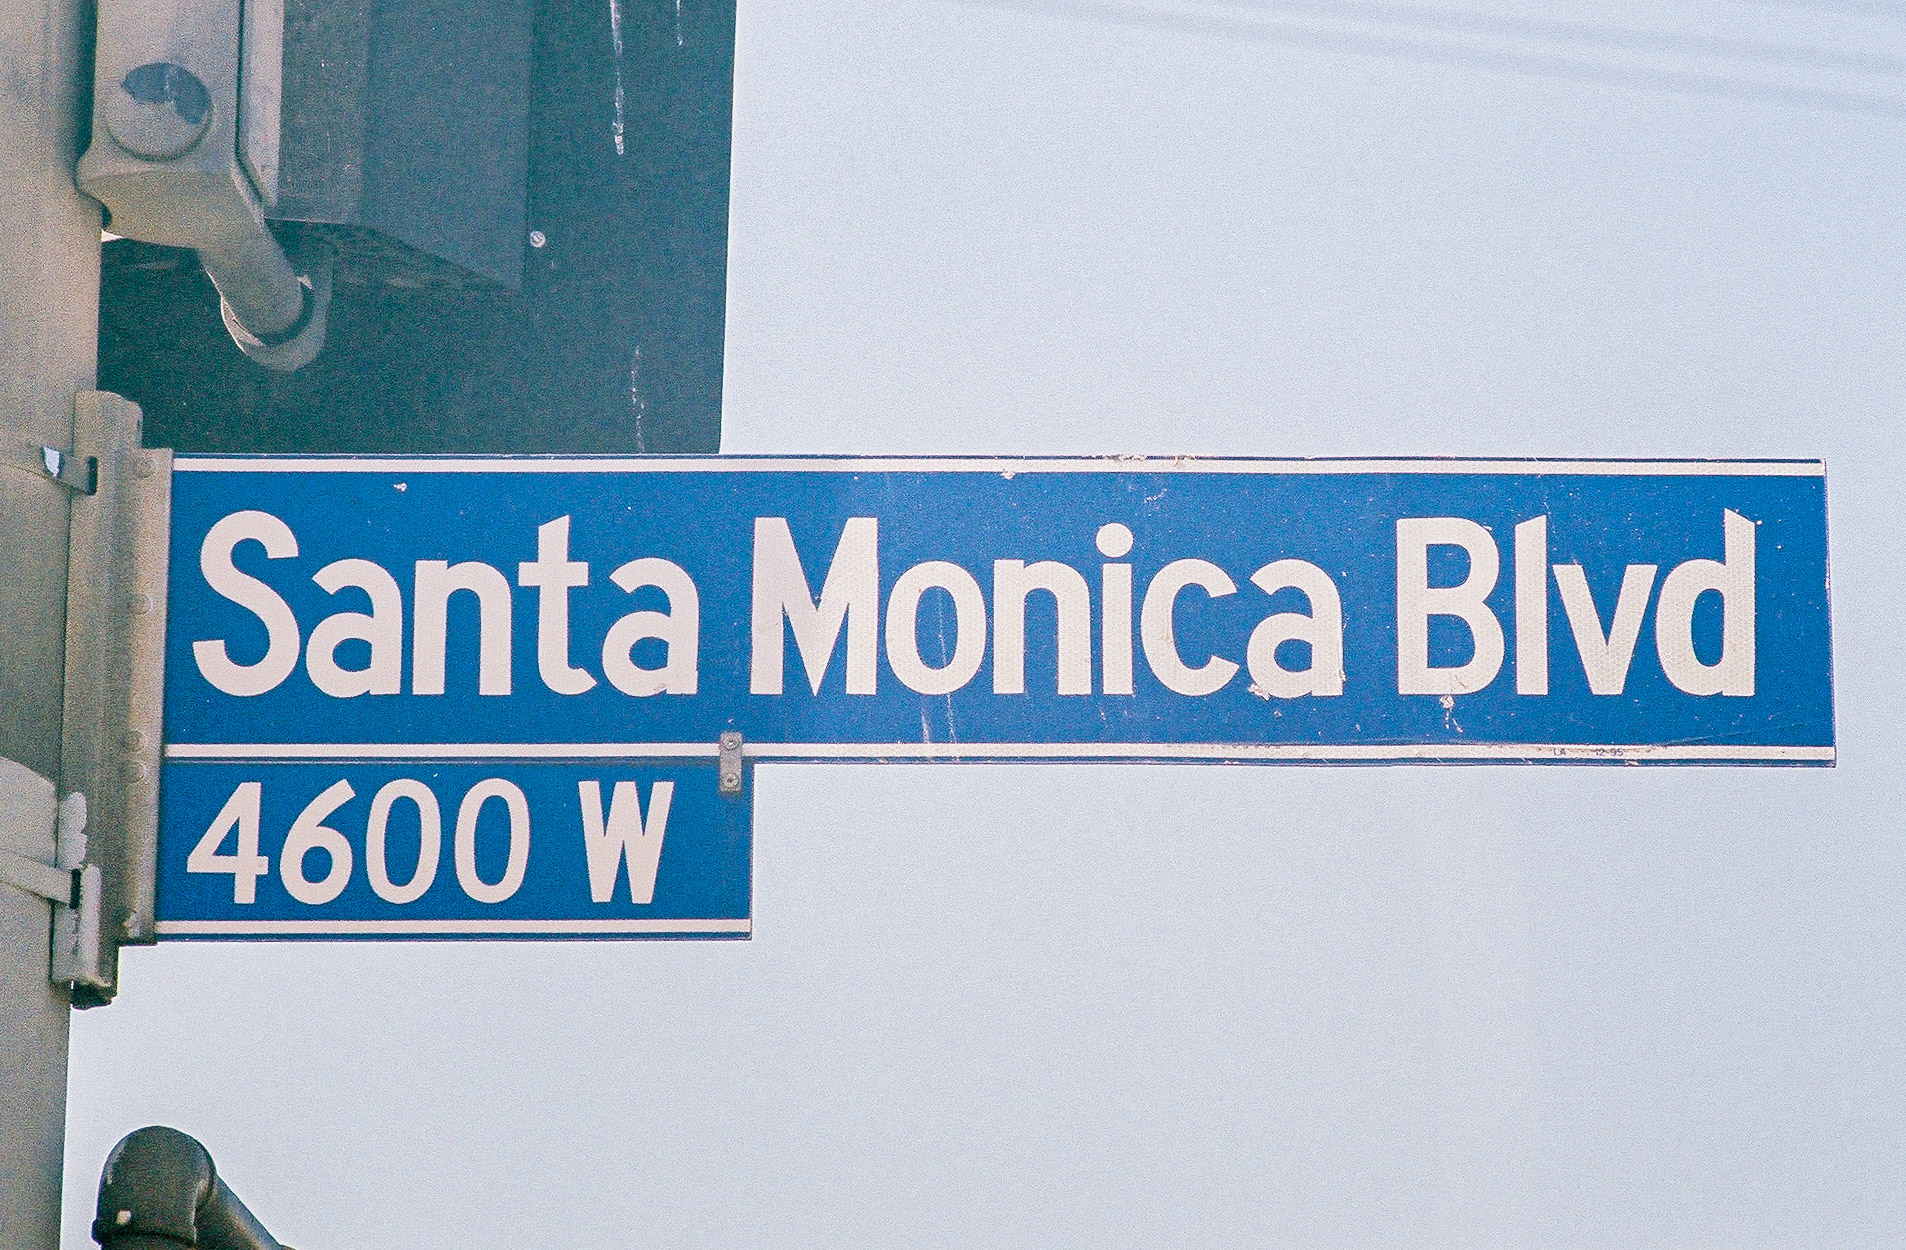
One of the exciting findings from the survey was that most pedestrians in Los Angeles use public transport to reach their destination, with 44.2% walking and 44.4% taking the bus. We also discovered that 12% of pedestrians are shopping, and 57% of pedestrians in the Santa Monica area (90066) shop very often for $10-30.
💡Tip! Click on the bar graph, double click to reset. Landscape view is optimal. Plotly chart
Using PowerBI, we created a graph of Hollywood (90028), which showed that meeting friends and going out is quite high. We also used Python code to extract values from a string sentence and make new features, such as determining the reason people visit a neighborhood.


The graph above is of Hollywood (90028) and meeting friends and going out is quite high.
Finally, we combined our data analysis with street photography to capture the essence of the great streets of Los Angeles. Armed with our camera equipment, we set out to different neighborhoods, such as Hollywood, Santa Monica, and Venice, to capture the vibrant culture and people. We used the data from the survey to plan our photography route, ensuring we visited the most popular areas and captured the activities that people engage in.
💡Tip! Pie chart for Landscape view only on phones. Click on the legend to remove for a different overall percentage!
This survey would assume most pedestrians in Los Angeles do not drive but take public transport. If you were to remove cars, 44.2% are walking to their destination and 44.4% take the bus.
Python Code
Pie Chart
import plotly.express as px

pie_fig = px.pie(chart_data_sorted_df,
     values=y_axis,
     names=x_axis,
     color_discrete_sequence=px.colors.sequential.Emrld)

pie_fig.update_layout(
        font=dict(color='#8a8d93'),
        title={
            'text': "How do you typically get to this neighborhood?",
            'y':.95,
            'x':0.55,
            'xanchor': 'center',
            'yanchor': 'top'},
        font_family="Courier New",
        title_font=dict(size=17, color='#a5a7ab', family="Courier New"),
        paper_bgcolor='#2D3035',
        plot_bgcolor='rgba(0,0,0,0)'
)

pie_fig.update_traces(marker = dict( line=dict(color='#000000', width=2)))

pie_fig.show()
pie_fig.write_html("piechart.html")
Extracting values from a string sentence and making new features.
question = "I Live Here, Passing through en route to somewhere else, To meet friends, To dine / drink, To shop"
find= 'to dine'
find_no_punct = re.sub(r'[^\w\s]', '', find)
question_no_punct = re.sub(r'[^\w\s]', '', question)

find_words = find_no_punct.lower().split()
question_words = question_no_punct.lower().split()


result=[word for word in find_words if word in question_words]
Creating Geo Coordinates (latitude, longitude) from street names.
def geo_street(street_01, street_02):
    parameters = {"address": street_01+" and " + street_02 +", Los Angeles",
              "key": AUTH_KEY}

    r = requests.get(f"{base_url}{urllib.parse.urlencode(parameters)}")

    data = json.loads(r.content)
    if data['status'] == 'OK' and  data['results'][0]['geometry']['location_type'] == 'GEOMETRIC_CENTER':
        lat = data['results'][0]['geometry']['location']['lat']
        lng = data['results'][0]['geometry']['location']['lng']
        formatted_address = data['results'][0]['address_components'][0]['long_name']
        geo_type = data['results'][0]['geometry']['location_type']
        zipcode = data['results'][0]['address_components'][6]['long_name']
        area = data['results'][0]['address_components'][1]['long_name']
    elif  data['status'] == 'OK' and  data['results'][0]['geometry']['location_type'] == 'APPROXIMATE':
        lat = data['results'][0]['geometry']['location']['lat']
        lng = data['results'][0]['geometry']['location']['lng']
        formatted_address = data['results'][0]['address_components'][0]['long_name']
        geo_type = data['results'][0]['geometry']['location_type']
        zipcode = np.nan
        area = data['results'][0]['address_components'][1]['long_name']
    elif data['status'] == 'ZERO_RESULTS':
        lat = np.nan
        lng = np.nan
        formatted_address = np.nan
        geo_type = np.nan
        zipcode = np.nan
        area = np.nan

    return lat, lng,formatted_address, zipcode, geo_type, area
In conclusion, combining data analysis with street photography is a great way to explore and discover the great streets of Los Angeles. It allows us to gain insights into the culture and activities of different neighborhoods, helping us plan our photography routes and capture stunning images that tell a story. With the right tools and equipment, anyone can embark on this journey and discover the beauty and diversity of Los Angeles’s great streets.